Nonprofit campaign benchmarking: static surveys vs real-time peer data
Strategy & Frameworks

Real-time peer benchmarking answers how your campaign compares to similar nonprofits while you can still act on it.
Every fundraising leader asks the same question mid-campaign: how does our campaign compare to similar nonprofits right now? For years the honest answer was "we won't know until next year's survey." That gap is the problem this guide solves.
Below we define campaign benchmarking, contrast static annual benchmarks with real-time peer benchmarking and explain the core metrics that make a benchmark useful.
What is nonprofit campaign benchmarking?
Nonprofit campaign benchmarking is the practice of measuring your fundraising performance against a reference point, either your own past results or the results of comparable organizations. The goal is to judge whether a campaign is on track and decide what to change while there is still time to act.
A benchmark is only useful when it is comparable and current. Comparable means the peer set matches your cause, size and channel mix. Current means the data reflects what is happening now, not what happened 18 months ago.
Internal vs external benchmarking
There are two ways to set a reference point, and strong programs use both.
Internal benchmarking compares a campaign to your own history: last year's appeal, your rolling retention rate or your typical cost to raise a dollar. It controls for the things that make your organization unique and shows your trajectory over time.
External benchmarking compares your results to other nonprofits. It tells you whether a result that looks fine internally is actually lagging the sector, or whether a soft year is a shared market condition rather than a problem with your campaign.
Internal benchmarking answers "are we improving?" External benchmarking answers "are we competitive?" You need both to act with confidence.
Static annual benchmarks vs real-time peer benchmarking
Most sector benchmarks come from annual surveys. A cohort of nonprofits submits data once a year, an analyst cleans it and a report ships months later. That report is valuable for planning, but it describes a version of the sector that no longer exists by the time you read it.
Real-time peer benchmarking works differently. It draws on continuously updated data from comparable organizations, so you can see how a campaign is tracking against peers while it runs.
Here is how the two approaches trade off.
Factor | Static annual benchmarks | Real-time peer benchmarking |
|---|---|---|
Data freshness | Months old by publication | Continuously updated |
Best use | Annual planning and board reporting | In-campaign course correction |
Peer matching | Broad cohort averages | Comparable cause, size and channel |
Speed to act | Next campaign cycle | This campaign cycle |
Main risk | Decisions based on stale conditions | Requires connected, clean data |
The trade-off is not that one is right and the other wrong. Annual reports still anchor long-range strategy. But if the question is "how are we doing right now," only current peer data can answer it in time to matter.

The metrics that make a benchmark useful
A benchmark is only as good as the metrics behind it. Three matter most.
Cost to raise a dollar
Cost to raise a dollar is the amount you spend to bring in each dollar of revenue. Divide total campaign costs by total revenue raised. A result of $0.25 means you spent 25 cents to raise $1.
It is the clearest read on efficiency. Benchmark it internally to track your trend and externally to see whether your channel mix is running lean or heavy against peers.
Donor retention rate
Donor retention rate is the share of donors who gave in one period and gave again in the next. If 1,000 donors gave last year and 450 gave again this year, retention is 45%.
Retention is a core growth lever. Acquisition is expensive, so a few points of retention often move net revenue more than a bigger acquisition push. Benchmarking retention early shows who is at risk while you can still act.
Response and average gift
Response rate and average gift size round out the picture. Together they explain why a campaign is up or down: fewer donors, smaller gifts or both. Peer context tells you whether a dip is yours to fix or a sector-wide pattern.
How to answer "how do we compare right now?"
Use a simple sequence any team can repeat.
Pick the peer set. Match cause, size and channel so the comparison is fair.
Choose 3 metrics. Cost to raise a dollar, retention rate and response rate cover efficiency, loyalty and reach.
Compare internal and external. Check your own trend first, then the peer benchmark.
Isolate the gap. Decide whether the issue is reach, gift size or retention.
Act this cycle. Adjust the audience, the ask or the follow-up while the campaign is live.
The point is not more dashboards. It is fewer, better decisions about who to contact next and what to do for them.
Where Dataro fits
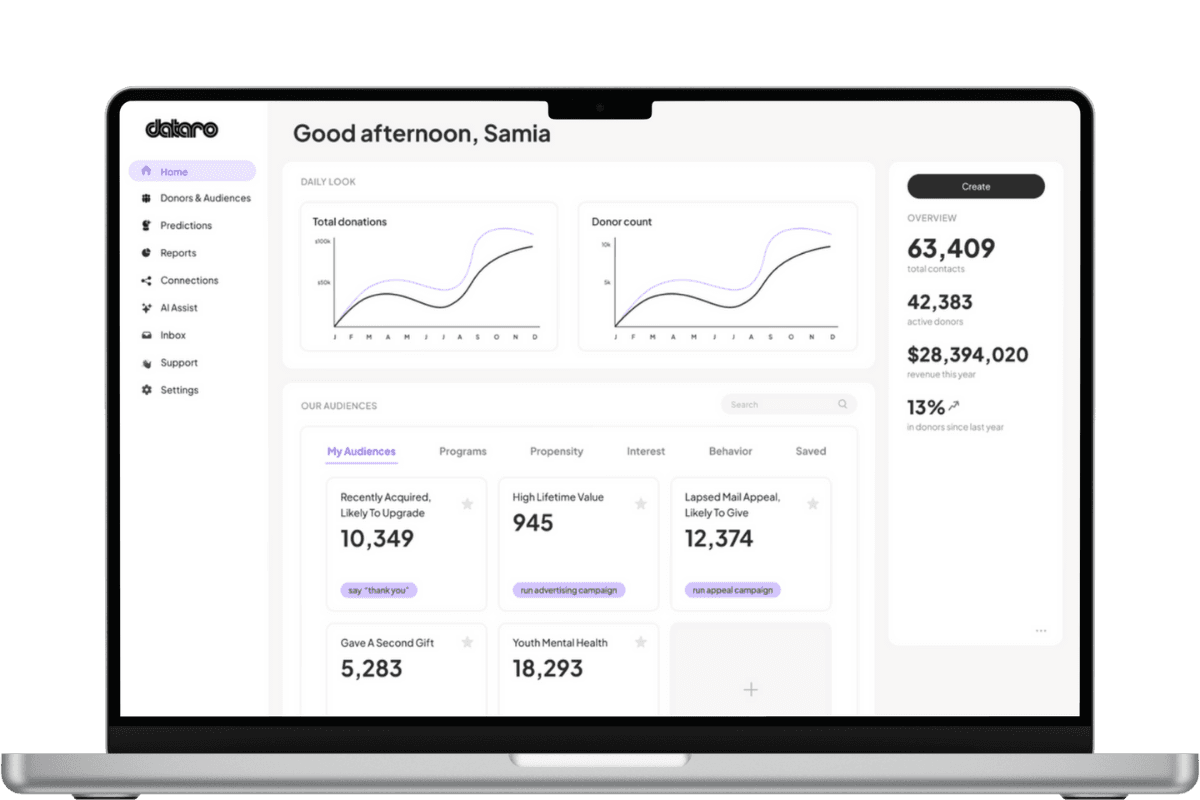
Benchmarking only helps if it turns into action. Dataro sits on top of your CRM, reads your data and returns ranked actions, so peer and internal benchmarks become a clear next step: who to prioritize, who is at risk of lapsing and where to trim mail volume without losing revenue.
That closes the loop between knowing how you compare and doing something about it while the campaign is still open.
Practical takeaways
Use internal benchmarks to track your trend and external benchmarks to test whether you are competitive.
Treat annual survey reports as planning tools, not in-campaign guidance.
Lead with 3 metrics: cost to raise a dollar, donor retention rate and response rate.
Match your peer set on cause, size and channel or the comparison misleads you.
Prioritize benchmarks you can act on this cycle over reports that arrive too late.
Conclusion
Static annual benchmarks tell you where the sector stood. Real-time peer benchmarking tells you where you stand now, while you can still change the outcome. Pair both, focus on a few clear metrics and turn the comparison into ranked actions your team can run this week.
Related articles
Find more nonprofit fundraising and data insights from the Dataro team.