How to measure the ROI of personalized fundraising content
Research & Data

Credible content ROI comes from holdout tests and revenue lift, not open and click rates.
The short answer
You measure the ROI of personalized fundraising content by comparing the revenue it generates against the revenue a matched control group generates without it, then subtracting the cost to produce and send it. Open rates and click rates tell you whether a message got attention. They do not tell you whether it raised more money.
The credible methods are holdout-test design, lift attribution and revenue-based metrics. The weak ones are engagement proxies treated as outcomes. This guide explains the difference and shows how to run the measurement with confidence.
Why open and click rates mislead
Definition: vanity metrics. Engagement signals such as open rate, click-through rate and time on page. They are easy to pull and feel responsive, but they correlate weakly with giving.
A personalized subject line can lift opens while leaving revenue flat. A donor who opens every email may already be committed and would have given regardless. When you report opens and clicks as proof of ROI, you measure attention and call it impact.
These metrics still have a use. They help diagnose where a message breaks down. If nobody opens, the problem is the subject line, not the ask. Use them to troubleshoot, not to justify spend.
The three credible ways to measure content ROI
What is a holdout test?
Definition: holdout test. A randomized design where a portion of your audience is deliberately withheld from the personalized content. The held-out group receives nothing or a generic version. The revenue gap between the two groups is the effect of the content.
A holdout test is the strongest method because it removes guesswork about what would have happened anyway. If the treated group gives $42,000 and a comparable holdout gives $31,000, the personalized content is responsible for the $11,000 difference, not the donors' pre-existing intent.
Practical rules for a clean holdout:
Randomize at the donor level, not the segment level, so the groups are genuinely comparable.
Size the holdout large enough to detect a meaningful revenue difference. Small holdouts produce noisy results.
Hold the test long enough to capture delayed gifts, not just same-week response.
Keep everything else equal: channel, timing and ask structure.
What is lift attribution?
Definition: lift attribution. Measuring the incremental revenue a piece of content produced above a baseline, expressed as lift. Lift is the treated group's result minus the control group's result.
Lift attribution is how you turn a holdout test into a number leadership can act on. Instead of claiming the campaign "worked," you report that personalization lifted revenue per donor by 18% against the control. That figure is explainable and easy to justify in a budget review.
Lift works best when it is tied to a control. Attributing lift without a baseline is just a before-and-after comparison, and before-and-after is contaminated by seasonality, other appeals and external events.
What are revenue-based metrics?
Definition: revenue-based metrics. Outcome measures tied directly to money: net revenue, revenue per donor, response rate on gifts, average gift and return on content cost.
Revenue-based metrics are the denominator-aware view. A campaign can raise more total revenue while losing money if the personalization cost more than the lift it produced. Net revenue and return on cost keep you honest.
Track these at minimum:
Net revenue: gross revenue minus production and send cost.
Revenue per donor: total revenue divided by donors contacted.
Incremental revenue: the lift figure from your holdout.
Cost per incremental dollar raised: content cost divided by lift.
Credible methods vs vanity metrics
Method | What it measures | Strength | Trade-off |
|---|---|---|---|
Open and click rates | Attention and engagement | Fast, cheap, good for diagnosis | Weak link to revenue; easy to misread as impact |
Holdout test | Causal effect of content on giving | Strongest proof; removes pre-existing intent | Requires withholding content from some donors; needs adequate sample size |
Lift attribution | Incremental revenue above a control | Explainable number for budget decisions | Only valid with a real baseline |
Revenue-based metrics | Net revenue and return on cost | Ties content to money and protects margin | Needs clean cost and revenue data |
The pattern is clear. Vanity metrics are cheap and fast but answer the wrong question. The revenue methods take more rigor and give you an answer you can defend.
Where predictions and behavioral data come in
Credible attribution depends on comparing like with like. If your treated and control groups differ in giving potential, the revenue gap reflects who was in each group, not what you sent them. This is where most in-house measurement breaks down.
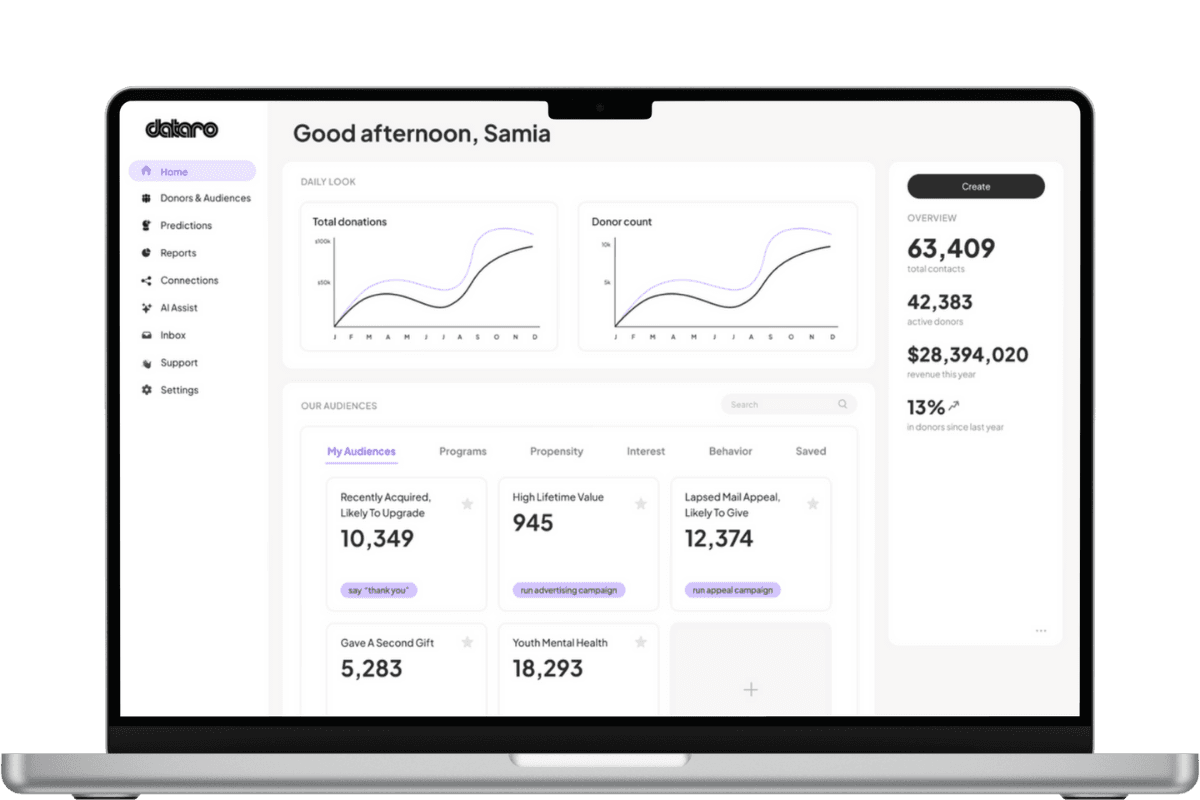
Dataro sits on top of your CRM and turns donor history into propensity scores and behavioral signals at the individual level. Those scores let you build matched groups, so the holdout and the treated group start from the same expected value. That is the foundation of a fair test.
The same predictive layer sharpens the content itself. Ranked lists tell you who to prioritize and what the next action should be, so personalization reaches the donors most likely to respond. When you then run a holdout, you are measuring the lift of good targeting, not the lift of sending more mail to everyone.
Predict, act, measure, repeat. Each cycle feeds results back as new signals, so the next test is sharper than the last.
A practical sequence to run this quarter
Pick one personalized campaign and define the outcome as net revenue, not opens.
Use propensity scores to build a randomized holdout at the donor level.
Run the campaign, then measure revenue across a window long enough to capture late gifts.
Calculate lift as treated revenue minus control revenue.
Subtract content cost to get net incremental revenue and cost per incremental dollar.
Report the lift figure, keep the vanity metrics for diagnosis only, and repeat on the next campaign.
Practical takeaways
Open and click rates diagnose problems. They do not prove ROI.
A holdout test is the strongest way to isolate what your content actually caused.
Lift is only credible against a real control group, so always build one.
Report net revenue and cost per incremental dollar, not gross totals alone.
Match your groups on predicted giving potential, or the comparison is unfair.
Conclusion
Measuring content ROI is a question of comparison. Hold out a matched group, attribute the lift, and judge the result in net revenue. Do that and you can tell leadership exactly what personalization is worth, in dollars they can approve. Predictive scoring and behavioral data make the comparison fair, which is what turns a measurement into evidence.
Related articles
Find more non-profit fundraising and data insights from the Dataro team.