How healthy is your fundraising program? 5 key things to track
General
With the launch of our new machine learning platform, we are not only providing NFPs with access to accurate predictions to improve fundraising response rates. We are also making it easier to track key metrics about the health of regular and cash giving programs.
When we talk about the ‘health’ of a fundraising program, what we are really examining is the performance of different parts of the program over time. Here are 5 of the key donor metrics Dataro measures via our machine learning platform.
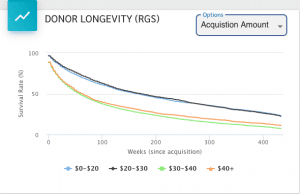
1. Donor longevity
Your organisation might be great at acquiring new donors, but how good are you at keeping them? Churn rates, or the ability to retain existing donors, are one of the key measures of a healthy regular giving program. There are many factors that can influence churn, including the quality of your ongoing donor engagement, acquisition channel, gender, age, original gift amount, and payment method. Breaking down attrition in these ways can also identify underperforming acquisition channels or other marketing issues.
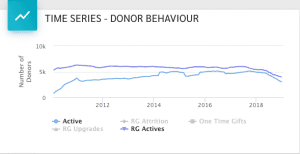
2. Active givers
Time series information about your active givers (people who have given a financial donation in the past 12 months, not including regular givers) and regular givers can provide a great overview of trends in your donor base, allowing you to catch any declines in giving before they gather momentum. Sometimes a drop in the number of givers over time can be disguised by higher dollar amounts, so time series information can help to identify falling donor numbers.
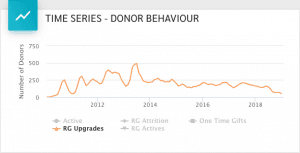
3. RG upgrades
Tracking upgrades can tell you not only the impact of your upgrade program, but also whether your donors perceive good value from their donations and are engaged with your communications.
4. Financial Time Series
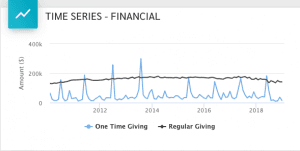
Financial metrics are obviously a key measure of fundraising success. By visualising donations received, you can easily interpret the success of your annual appeals by looking for ‘spikes’ in giving (e.g. a spike around tax time for your tax appeal), and catch trends in RG and cash giving volumes to identify any issues with your programs that may require further investigation.
5. Geospatial/location metrics
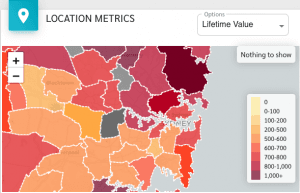
Location metrics allow you to identify fundraising hotspots, key audiences and to track the success of location-driven programs such as face-to-face deployment and unaddressed mail-outs. You can also assess the relative performance of your donor base by postcode, including the average LTV of donors from different areas, total giving amounts and number of active givers.
Related articles
Find more not-for-profit fundraising and data insights from the Dataro team.