Fundraising analytics: 20 critical metrics & how to use them

Nic Miller
Strategy & Frameworks

Fundraising analytics that drive decisions: the 20 metrics worth tracking, and the next move each one points to.
Most fundraising teams don't have a data problem. They have a stack of reports and no clear read on what to do next.
The dashboards refresh. But when it's time to set an appeal cutoff, work out who to call this week or spot which donors are slipping away, the numbers rarely point to a clear answer. So teams fall back on last year's rules and gut feel, then over-mail to feel safe or under-mail out of fear.
Analytics should fix that. The point isn't to track more. It's to track the few things that turn into a ranked action you can explain and run.
Below are 20 fundraising analytics metrics worth your attention, grouped by the two decisions every fundraising team has to make: who to focus on, and what to do next.
Why metrics fail when they sit in a dashboard
A metric is only useful if it changes what you do. Retention rate on a slide doesn't save a single donor. The same number, tied to a named list of at-risk givers and a next action, does.
That's the test for everything below. For each metric, ask: what does this tell me to do, and who does it point to? If the answer is "nothing" or "everyone," it's a vanity number.
Two decisions matter most:
Focus: who deserves attention right now, and why
Act: what to do for each of them next, across every program
Good metrics ladder to one of those two.
Focus: who deserves attention
These metrics help you set a clear cutoff and put effort where it pays back.
1. Donor lifetime value (LTV). Total expected value of a donor over the full relationship, not a single gift. Use it to work out how much you can justify investing to acquire and keep a donor.
2. Average gift size. Mean gift per donor or per appeal. Watch the trend, not the single number. A rising average alongside falling volume tells a different story than the reverse.
3. Gift frequency. How often a donor gives in a period. Frequency often predicts future value better than the size of any one gift.
4. Recency. Time since the last gift. Recency is one of the strongest signals of who's likely to give again, and one of the most underused.
5. Donor propensity score. A modelled likelihood that a donor responds to a given appeal or action. This is what lets you mail fewer people with confidence instead of mailing everyone and hoping.
6. Major-gift capacity. An estimate of how much a donor could give at their highest level. Pair capacity with propensity so the team chases willing donors, not just wealthy names.
7. Segment penetration. The share of a segment you're actually reaching and converting. It exposes where you're over-invested and where there's untapped room.
Act: what to do next
Focus tells you who. Act tells you what happens for each of them, so activity compounds instead of resetting every campaign. It splits into two moves: who to contact now, and the follow-through after the touch.
Who to contact now
These metrics tell you whether your outreach is landing, and where to adjust timing and channel.
8. Response rate. Share of contacted donors who give. The cleanest read on whether your targeting and message match.
9. Conversion rate. Share of a defined audience that completes the action you wanted, from first-time gift to upgrade.
10. Channel performance. Response and net revenue broken out by channel: mail, email, phone, SMS, digital. The goal is fewer, better-timed touches on the channels that work for each donor.
11. Cost per dollar raised. What you spend to raise $1. Track it by channel and appeal so rising costs show up before they eat your margin.
12. Return on investment (ROI). Net revenue against cost for an appeal or program. ROI is the number that justifies cutting 8,000 mail packs when those packs aren't earning their place.
13. Email engagement. Open and click-through rates, read in trend. Falling engagement is an early warning that you're sending too much or to the wrong people.
14. Appeal-level net revenue. Revenue after costs for a single appeal. It keeps you honest about which campaigns actually contribute.
The follow-through after the touch
These metrics drive what comes next, where most value is won or lost.
15. Donor retention rate. Share of donors who give again in the next period. Small gains compound. Acting early on the donors about to lapse is one of the highest-return moves in fundraising.
16. Attrition (lapse) rate. The mirror of retention: donors lost over a period. Track it by segment so you can see who's leaving while there's still time to act.
17. Reactivation rate. Share of lapsed donors who return. A steady reactivation program quietly rebuilds the file without new acquisition spend.
18. Upgrade rate. Share of donors who move to a higher giving level, including single-to-regular conversions. Often the cheapest growth you have.
19. Regular-giver churn. Cancellation rate among monthly or recurring donors. Recurring revenue is your most predictable income, so churn here deserves early-warning treatment, not a quarterly autopsy.
20. Pledge fulfilment rate. Share of pledged value actually collected. A gap between pledged and received points straight to a stewardship or follow-up fix.
How to turn 20 metrics into a weekly rhythm
Twenty metrics is a menu, not a checklist. Tracking all of them at once is how teams end up with dashboards nobody acts on.
Start with what you're trying to do this month:
Pick one move. Setting an appeal cutoff? Lead with propensity, recency and ROI. Worried about churn? Lead with retention, attrition and regular-giver churn.
Tie each metric to a named list. A retention rate becomes useful the moment it points to the donors about to lapse.
Attach a next action. Call, upgrade ask, stewardship, suppression or holdout. The metric's job ends when the action begins.
Measure, then repeat. Feed the result back in and let it sharpen the next round.
That loop, predict then act then measure then repeat, is what separates a team that reports on fundraising from a team that runs on it.
Where Dataro fits
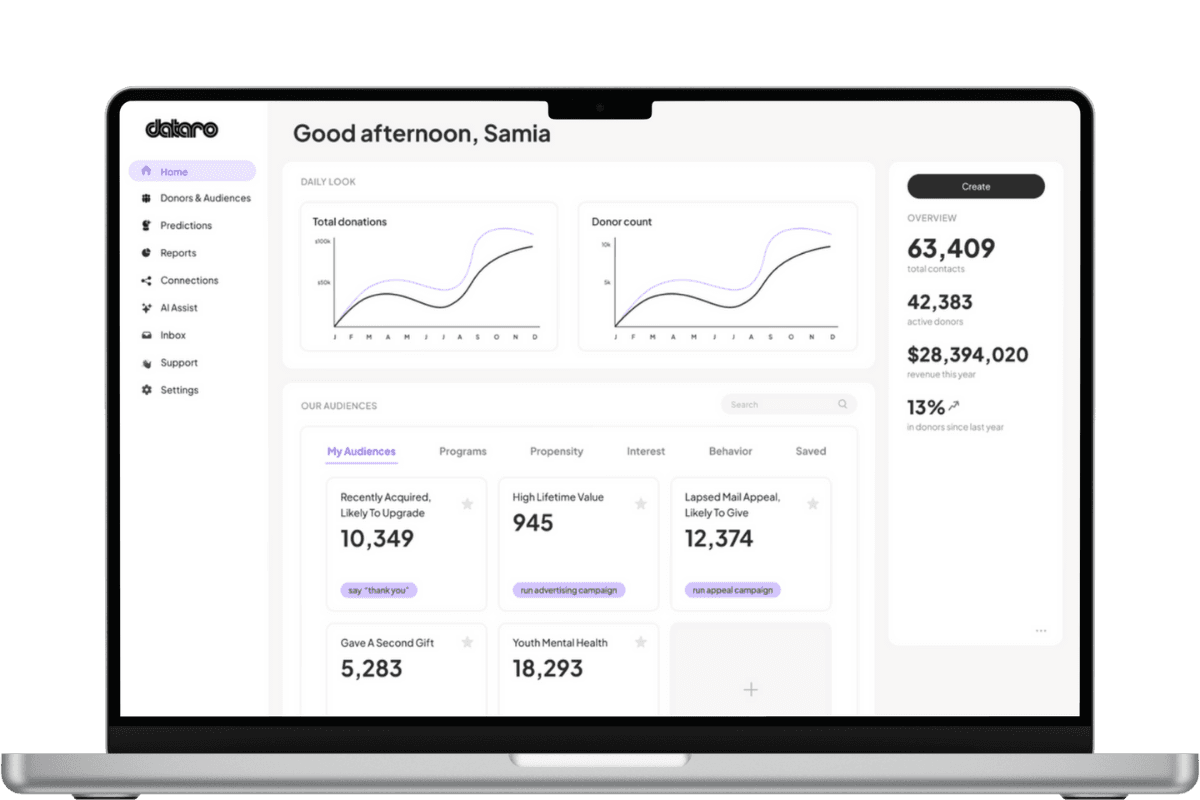
Dataro is a predictive layer that sits on top of your CRM and tells you what to do for every donor, right now. It turns this data into ranked actions: who to focus on and what to do next.
The metrics stay inspectable and the cutoffs stay clear, explainable and easy to justify, so you can mail fewer people with confidence and protect results, without adding another dashboard to babysit.
If you want to see what this looks like on your own donor file, book a working session and we'll walk through the actions these metrics should be driving.
Related articles
Find more not-for-profit fundraising and data insights from the Dataro team.