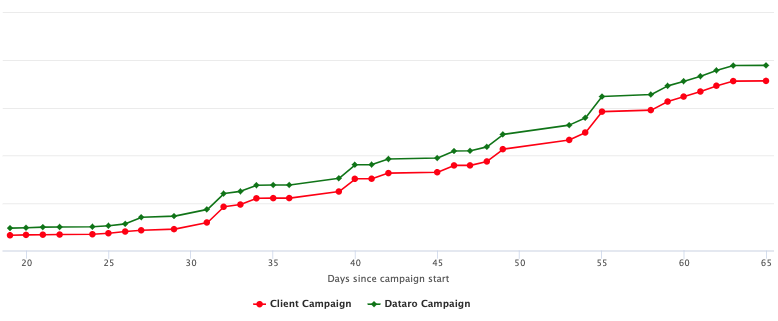
Dataro recently teamed up with a leading environmental organisation to test machine learning techniques against traditional segmentation for a direct mail shoulder appeal. Using a custom ‘live-tracking’ app, Dataro tracked and reported on campaign results as they came in. After 65 days of responses, the results showed a clear win for machine learning:
- 12.7% improvement in net revenue using Dataro
- 6.9% response rate for Dataro vs 5.3% response rate for RFM
- 22.8% improvement in ROI using Dataro
- The largest single gift came from a Dataro selection
Here’s how we did it.
Setting up the test
Choosing which supporters to contact in a direct mail appeal has traditionally been a time consuming task. Using manual methods such as RFM (recency, frequency, monetary value), charities or their agencies have created ‘segments’ to group supporters together based on recent giving history. Certain segments are then selected for inclusion in the campaign.
Rather than segments, Dataro uses machine learning to analyse patterns in the charity’s entire history of fundraising, including transactions, engagement and communications data, to paint a much more detailed picture of giving. Each donor is then given a ‘propensity score’ reflecting their probability of giving. We can then make a recommendation about who to include and who to exclude from the campaign, as well as the optimum list size and ask strategy.
In order to measure the difference between the RFM list vs Dataro’s list, we used the following methodology:
- We generated propensity scores for every donor reflecting their propensity to give during the Spring Appeal. Using these scores, we generated a recommended campaign list.
- Our charity partner supplied us with its proposed campaign list, selected using RFM analysis.
- We compared the Dataro list against our partner’s proposed campaign list to identify three categories of donor:
- Donors appearing in both lists were labelled blue;
- Donors our partner selected using RFM but which Dataro would removed were labelled red; and
- Donors Dataro selected but which our partner had not chosen using RFM analysis were labelled green.
- The direct mail appeal was sent to all donors from both lists, allowing us to compare responses from the Dataro selections (blue + green categories) vs the client selections (blue + red categories).
Analysing the results
Using a custom-built web-app, Dataro tracked responses from each category of donors. In every measure, the machine learning list outperformed the RFM selections. Critically, the results highlighted some of the shortcomings of the traditional RFM approach, including:
- RFM is not able to identify between different donors that fall within the same ‘segment’, notwithstanding that most donors in the segment do not give to the campaign, resulting in lower response rates and wasted costs; and
- RFM ‘missed’ a large number of donors that were very likely to give, because they did not fall into one of the chosen ‘segments’, resulting in lower revenue.
Net revenue
Net revenue is the critical test of performance. In this case, net revenue takes into account the total costs vs total returns from the campaign. The Dataro campaign performed nearly 13% better than RFM campaign.
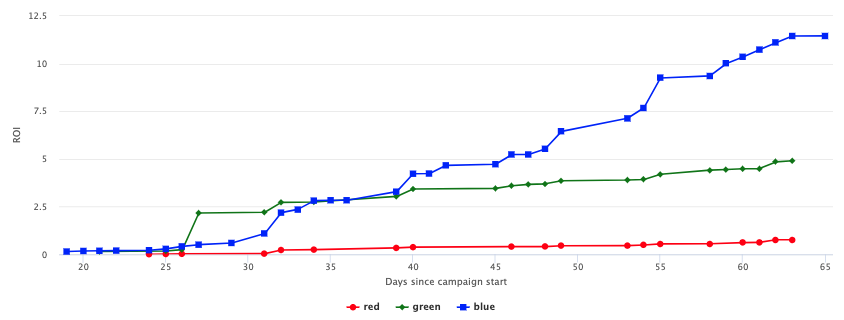
ROI
ROI is another important measure of performance. Critically in this case, the results showed that the ‘red’ segment (i.e. the donors selected with RFM but that Dataro suggested be removed) actually returned an ROI of less than 1, meaning the charity partner lost money by contacting those donors. The ‘green’ section (i.e. ‘extra’ donors Dataro identified) had an ROI of close to 5, while the blue segment (i.e. donors on both lists) had an ROI of close to 12.
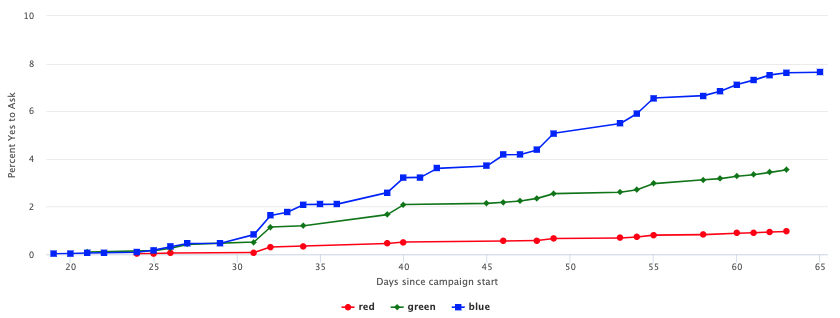
Response Rates
Response rates can be useful to track the effectiveness of list selections. Of course, some ‘segments’ normally respond and higher levels than others. Again, however, the analysis showed that the ‘red’ segment responded at under 1%, while the ‘green’ segment performed much better (nearly 4%) and the blue segment performed strongly (nearly 8%).
The test demonstrates how the ability to identify donors who are more likely to participate can help charities to save costs (through reduced mail volumes), save time (through easier list selections), and raise more funds from DM appeals.